6 min to read
Monitoring Cassandra with Prometheus

Prologue
So, now that we have a Cassandra cluster (I like to name it like this as it sounds better and more professional even though it’s only one instance) running on a Ubuntu machine on the Data Center everything is perfect as the SEO team who are the one consuming and posting data to the database are just starting to use it and they haven’t broke the dam thing yet. Once they start breaking thinks it’s where all things must start to be truly monitored in order to notice if the Cassandra service is running at all on the host.
Imagine this, it’s 5:58 pm on a Friday afternoon and you are 2 minutes away from the end of your day and the start of the weekend, you had already plans to go to a nice dinner with your girlfriend and you have been waiting for this for a couple of days; SEO team runs daily, weekly and monthly jobs that use the Cassandra cluster to read/write data, as this jobs are indexing a lot of keywords for the sites on where they are implemented the load of this jobs are really considerable, and from time to time, the daily. weekly and monthly jobs run at the same time. Remember that guy that was 2 minutes away from his lovely dinner and weekend? Well that guy had a lovely dinner and slept like a baby after the big hamburger he had and he then went to the beach for the weekend, what this guy doesn’t know is that he will be f*cked when he returns the next Monday and SEO team, product managers, dev leaders, CEO, CTO and the cleaning lady will say to him that all the jobs, which were super important, failed and they didn’t know how/when/what/who/etc it happened.

After seeing the logs of the Cassandra cluster, which runs on a 24GB and 8 cores hosts, you noticed that it just simple crashed and therefore the service itself wasn’t running, you simple run ##service cassandra restart## and everything goes back to normal, you are able to connect to the cluster and query the tables as well as the SEO team is able to get some data on the internal website they have. They start to run the jobs again, and after 6 hours or so all the jobs have completed successfully and you are just praying this doesn’t happen again. Guest what, It will happen again, and more often as all the data that is being consumed by Cassandra will growth exponentially to a point you could never imagine, that’s not even the sad part, the truly sad part is that you have ZERO monitoring on this mission critical service.
The Problem
Introducing Prometheus, the open source monitoring tool that, when used correctly, can help poor guys that don’t have a clue on how to effective monitor mission critical services and by that saving a lot of emails, calls, insults and everything from a mad boos or just any mad person. I will talk about Prometheus and how we actually manage all other services with it, as well as the configurations and the infrastructure on where you can launch it on a different post,
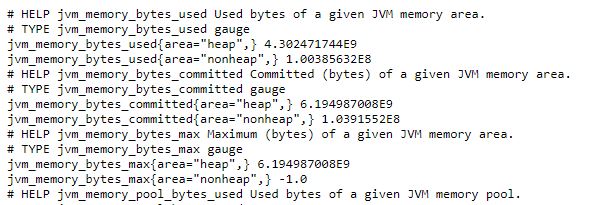
Once you have Prometheus and Cassandra up and running you will need to download the JMX exporter, who is the one that does all the job for Prometheus, let me explain, Cassandra is running as a service on a specific port (default is 9042) and by that you will need to “hit” or scrape that port so you can confirm whether the service is up or not. That being said, Prometheus can’t hit this port not the protocol itself so you will need to have an easier endpoint coming from Cassandra so Prometheus can read it right away and give you the metrics you need. The JMX Exporter is just what you need, once installed it will start dumping a lot of useless metrics to the default port 80, yes you read correctly, useless metrics as the only thing you need to have is a valid website on port 80 so Prometheus can scrape it and therefore tell you if the Cassandra service is up or not. We will come back to this later. Let’s install this awesome exporter.
The Solution
You will need to run the following commands on the folder where you Cassandra cluster is installed, in my case was /etc/cassandra/
1 wget https://repo1.maven.org/maven2/io/prometheus/jmx/jmx_prometheus_javaagent/0.5/jmx_prometheus_javaagent-0.5.jar
2 wget https://raw.githubusercontent.com/cepefernando/jmx_exporter/master/example_configs/cassandra.yml
3 echo 'JVM_OPTS="$JVM_OPTS -javaagent:'$PWD/jmx_prometheus_javaagent-0.5.jar=7070:$PWD/cassandra.yml'"' >> conf/cassandra-env.sh
Easy, right? By the time of this writing the latest version of the exporter was the jmx_prometheus_javaagent-0.5, in a near feature it may change so be please be aware.
Remember the useless metrics I previously mentioned? Well the effective monitoring comes to play in here, I modified the cassandra.yml to only posts the vary basic metrics for the Cassandra cluster, which are 69 lines. Without modifying it, the default configurations post all the metrics which are approximately 69386, a huge difference, by doing this you now have a 3.4KB website and not a 500KB. If you don’t change the default setting be prepared to expect hangs from the JVM exporter as it is being consumed by Prometheus and the actual Cassandra cluster that posts metrics every second as the data changes.
Now you can restart Cassandra and browse to the http://IP-of-your-hostst/ and voilá, a simple website is now running and that’s exactly what you need for your scrape endpoint.
The End
You can now go to your weekend knowing that you will not have any surprises on Monday, and if you do, it will not be something related to your Cassandra Cluster (Or it may, maybe your disk got full or something else related to the host).
Please feel free to ask me anything or comment if you liked my post.